
How Does Perforated Aluminum Sheet Affect Airflow and Pressure Drop?
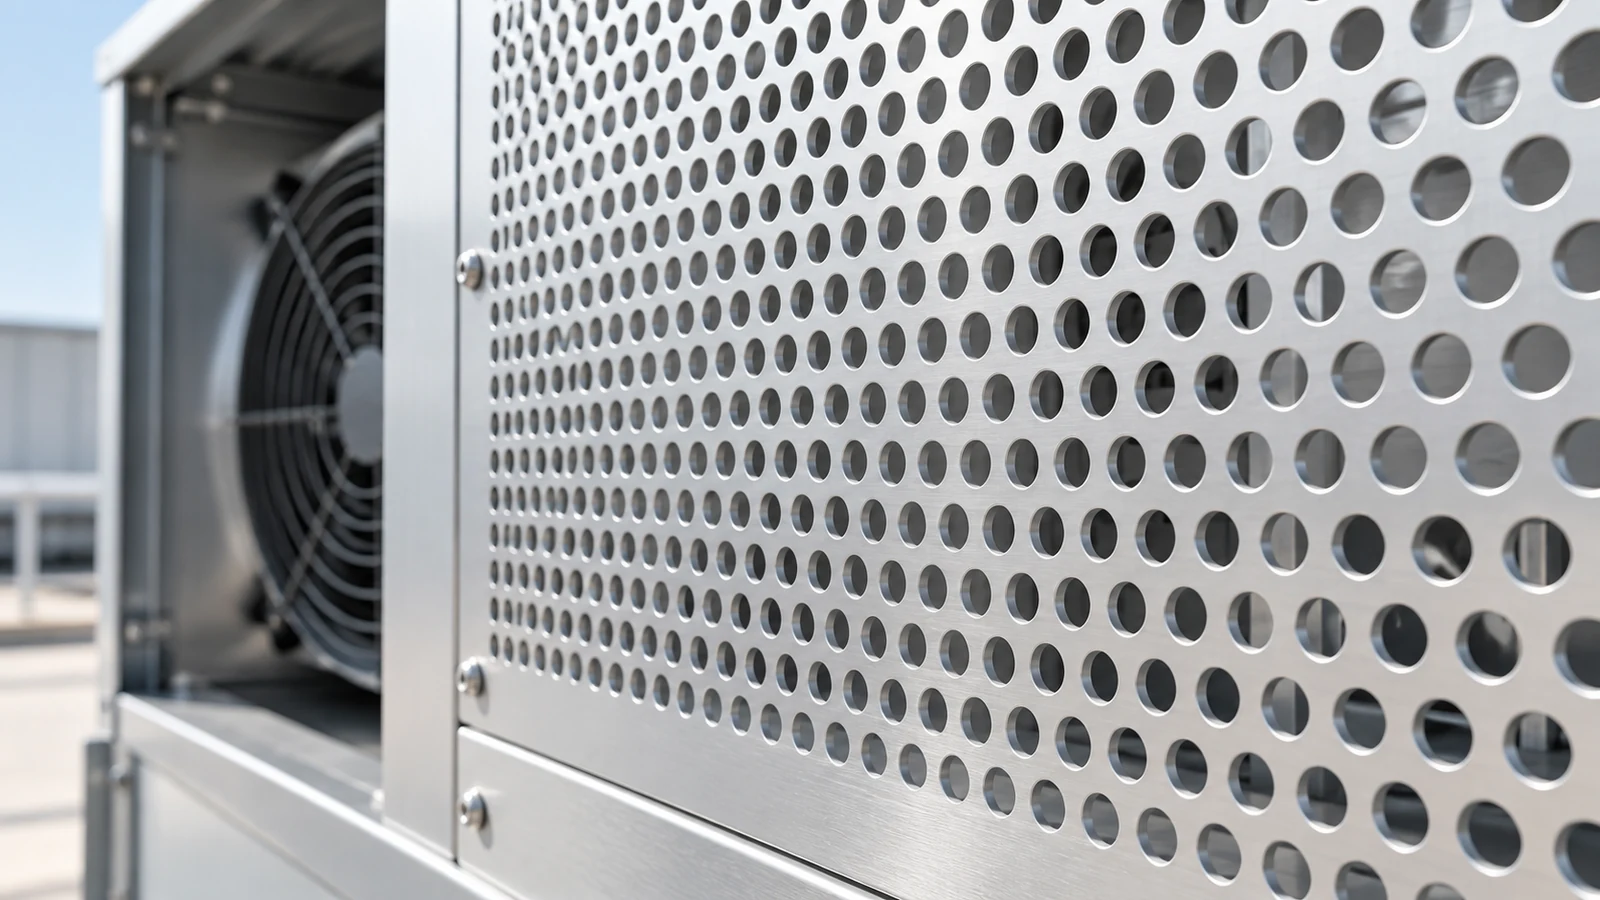
Perforated aluminum sheet can provide a ventilation path, but open-area percentage is not an airflow or pressure-drop rating. Begin with the hole pattern, calculate the openings available after solid borders and installation obstructions are considered, and then evaluate the pressure loss at the required flow. Two panels with the same percentage of openings can behave differently when their hole dimensions, thickness or flow conditions differ.
For ventilation guards and fabricated panels in TOP METAL’s perforated aluminum plate range, the specification should connect the panel drawing with the required airflow and permitted pressure drop. The calculations below are hypothetical design-reading examples, not product airflow test results or standard catalog dimensions.
Calculate Open Area From the Hole Pattern, Not Diameter Alone
Compare straight and 60-degree staggered round holes
For round hole perforated aluminum sheet, hole diameter is only one input. Center-to-center spacing, also called pitch, and the arrangement of the holes determine how much metal is removed from the repeating pattern.
Let d be hole diameter and p be center-to-center pitch, expressed in the same units. Let φ be the open-area fraction of the regular perforated field. For straight rows, assume equal horizontal and vertical pitch. For a 60-degree staggered pattern, use the equal nearest-neighbor pitch of the triangular arrangement.
Hypothetical 3 mm holes on 5 mm centers
| Round-hole arrangement | Open-area fraction | Calculated percentage |
|---|---|---|
| Straight, equal centers in both directions | φ = (π ÷ 4) × (d ÷ p)² | 28.27% |
| 60-degree staggered | φ = [π ÷ (2√3)] × (d ÷ p)² | 32.65% |
Both examples use the same diameter and pitch, yet their repeating cells have different areas. Dividing the circular hole area by the appropriate cell area gives the difference. Multiply the fraction by 100 to express it as a percentage.
Keep the pattern percentage separate from the finished panel
These formulas describe a regular hole field, not automatically the entire finished sheet. They do not account for solid margins, internal blank zones, irregular patterns or incomplete rows at the boundary. Use the controlled drawing, CAD geometry or actual hole count when the finished opening area needs to be established precisely.
When specifying a perforated aluminum panel from TOP METAL, identify the hole shape, pitch, pattern direction, thickness and solid zones on the same drawing. This makes the geometry used in the airflow assessment clear and avoids treating a pattern percentage as the opening area of the assembled panel.
Convert Pattern Open Area Into Installed Free Area and Velocity
Subtract solid margins and blocked regions from the airflow path
Apply the pattern fraction only to the perforated area exposed to the intended airflow. Solid borders contain no openings, while a frame, overlap or internal bracket may block holes that would otherwise be available. Distinguish geometric opening area from an equivalent flow area adjusted by a discharge coefficient.
Consider a hypothetical 500 × 500 mm panel with a 25 mm solid margin on every side. The remaining perforated field is 450 × 450 mm. Using the 60-degree staggered pattern above, and assuming no further obstruction:
Approximate hole area = 0.450 × 0.450 × 0.3265 ≈ 0.0661 m².
Relative to the 0.2500 m² outside panel area, the openings occupy approximately 26.45%, not 32.65%. The larger percentage describes the perforated field; the smaller one includes the solid border in its denominator.
Distinguish face velocity from mean velocity through the holes
When volumetric flow Q is known, mean velocity across a specified area is Q/A. Assume, solely for this example, that 0.20 m³/s, equivalent to 720 m³/h, passes through the panel with no bypass leakage.
Different area definitions give different reference velocities at the same assumed flow
| Area basis | Area | Mean velocity at Q = 0.20 m³/s |
|---|---|---|
| Outside panel face | 0.2500 m² | 0.80 m/s |
| Perforated field, including metal between holes | 0.2025 m² | 0.99 m/s |
| Approximate total hole area | 0.0661 m² | 3.03 m/s |
There is no contradiction between these velocities: their reference areas differ. A pressure-loss report that uses the active opening or duct area as its face-velocity basis cannot be compared directly with one using the outside panel area unless the definitions are reconciled.
The calculation uses a periodic-pattern approximation and ignores discrete boundary-hole effects. It also assumes steady, low-compressibility flow through the available openings. The mean hole velocity is not a local peak velocity. Most importantly, the flow was supplied as an input; the open-area calculation did not predict it.
Why Equal Open Area Does Not Guarantee Equal Pressure Drop
Consider thickness-to-hole-diameter ratio and flow regime
Equal open area does not uniquely define flow resistance, even when the same flow and exposed panel area are considered. The ratio of sheet thickness to hole diameter, t/d, and the flow regime also matter. Air entering and leaving the holes encounters changes in flow direction and speed, including separation, contraction and downstream expansion.
For example, 3 mm holes on 5 mm centers and 6 mm holes on 10 mm centers have the same d/p ratio. If both use the same 60-degree staggered arrangement, they have the same ideal pattern open area. With an assumed sheet thickness of 1.5 mm, however, their t/d ratios are 0.50 and 0.25, respectively. Equal percentages have not produced identical passage geometry.
Li, Davidson and Peng’s 2024 study models pressure loss through circular perforations in laminar and turbulent flow, with attention to porosity and thickness. Its relevance here is that geometry and flow regime must be considered together. It does not justify a universal rule that thicker sheet always produces more pressure loss, or that a model for round holes applies to every decorative pattern. [1]
Do not apply a universal pressure-loss coefficient
A pressure-loss coefficient is useful only with its stated geometry, flow regime and reference velocity. A coefficient based on upstream face velocity is not interchangeable with one based on mean velocity through the holes. Nor should a model for circular holes be assigned without validation to decorative cutouts or slots.
When comparing alternatives, hold the duty point and reference conditions constant. Ask for pressure drop at the same flow through the same exposed area, then check the hole geometry and thickness behind each result. Without those conditions, a lower advertised pressure-drop number may simply describe a different test.
Treat the Vent Panel as Part of the Fan-and-System Operating Point
A free-air fan rating is not the installed airflow
A fan’s free-air flow rating does not establish the flow after a perforated panel is installed. The operating point is where the fan’s pressure-flow curve meets the system’s resistance curve. The panel contributes to that resistance alongside filters, passages and other components. [2]
For a fixed-speed fan on a stable operating branch, an increase in resistance will generally reduce airflow. A regulated system may instead change fan speed to maintain flow, within its available operating range. Neither situation can be resolved from the hole percentage alone.
Read the panel pressure drop at the required flow
Start with the application’s required flow and the pressure loss allowed for the panel. Compare candidate panels at that same flow, exposed area and stated air conditions. A pressure-drop value measured at a lower flow is not evidence that one panel is the better choice.
Next, include the panel in the assessment of the complete airflow path, together with filters, ducts and other relevant components. Keep the pressure definitions consistent with the fan-performance data; a static-pressure figure and a total-pressure loss are not interchangeable. Check whether the fan and system curves meet at or above the required flow. [2]
If the system falls short, reassess the exposed panel area, hole layout or fan selection, then check the revised arrangement. Increasing the open-area percentage alone is not a complete solution if the installation still restricts the airflow or the change compromises stiffness or guarding. The earlier 720 m³/h example remains an assumed input, not a predicted performance value.
For enclosure projects, TOP METAL’s electronics and enclosure aluminum solutions provide a starting point for material, panel geometry and finish requirements. Coordinate those choices with the equipment designer’s airflow assessment: a suitable aluminum cover still needs to work within the complete cooling-system design.
Require Airflow Evidence That Matches the Finished Assembly
Match geometry, reference velocity and test conditions
A pressure-drop curve is meaningful only when its test specimen and conditions can be related to the proposed installation. For example, Erdle’s published air-loss guidance describes thin-gauge specimens under uniform, non-swirling airflow directed perpendicular to the plate. It warns that distorted or angled approach flow changes the loss. [3]
A bare-sheet result therefore should not be presented as a verified result for an assembly with a frame, filter, backing mesh or a different approach-flow pattern. Use the report to establish what was tested, not just to extract one pressure number.
Conditions to reconcile before comparing panel pressure-loss data
| Evidence item | What should match or be explained |
|---|---|
| Specimen geometry | Hole shape, dimensions, pitch, arrangement, sheet thickness and solid regions |
| Area and flow basis | Exposed area, volumetric flow and the area used to calculate any quoted velocity |
| Air conditions | Temperature, density or other stated reference conditions |
| Pressure measurement | Pressure definition, measurement locations, units and method |
| Approach flow | Flow direction, uniformity and nearby components affecting the inlet condition |
| Assembly scope | Bare sheet or finished panel, including any frame, filter, mesh and potential bypass paths |
Use this comparison to identify the conditions that are equivalent and those that still need clarification. A missing test condition should be resolved before comparing results, not replaced with an assumed value.
Keep airflow, stiffness and guarding requirements separate
A panel that meets the airflow target has not automatically met its stiffness, fastening or guarding requirements. Likewise, a smaller opening selected for a protective function does not prove that the completed enclosure receives enough air. Review these requirements together, but retain separate evidence for each.
The perforated aluminum sheet quotation guide covers the wider material, fabrication and delivery package. Keep the airflow evidence with that specification, rather than replacing it with a target open-area percentage.
A useful ventilation specification connects hole geometry, available opening area, required flow and an applicable pressure-loss basis. To discuss perforated aluminum sheet metal with TOP METAL, submit the panel drawing and ventilation requirements, including the hole pattern, thickness, exposed area, installation arrangement, required flow, maximum permitted pressure drop and quantity. Request the supporting information available for the proposed configuration so that the panel and the system are evaluated against the same requirements.
Technical References
[1] Li, S.; Davidson, L.; Peng, S.-H. (2024). A pressure-loss model for flow-through round-hole perforated plates of moderate porosity and thickness in laminar and turbulent flow regimes. International Journal of Heat and Mass Transfer, 226, 125490. DOI: 10.1016/j.ijheatmasstransfer.2024.125490.
[2] Howarth, W. (2020). Straightening Out Fan Curves. AMCA inMotion, October 1, 2020. See the duty-point, pressure and system-curve explanations.
[3] Erdle Perforating. Pressure Loss, section “Pressure Loss Through Perforated Plate (Air).” Undated technical guidance; accessed October 27, 2026. Used here for its test conditions and limits, not as a TOP METAL product rating.